Markets & Economy
How Bond Yields Work: Prices, Rates and What the Yield Curve Signals
A bond yield is the return an investor earns for lending money. It moves opposite to the bond price, and the pattern across maturities, the yield curve, is one of the most watched signals in finance.
By Wells Love Editorial Desk · · 10 min read
Key takeaways
- A bond's yield rises when its price falls, and falls when its price rises.
- Duration shows how sensitive a bond is to changes in interest rates.
- The yield curve shows what lenders demand across maturities, and an inversion is a warning signal, not a forecast.
Few numbers in finance are quoted as often as the yield on a government bond. News bulletins report that the ten-year yield rose or fell, mortgage lenders adjust their rates, and companies decide whether to borrow now or wait. Yet the idea behind the number is simple: a yield is the return a lender earns for handing money to a borrower, expressed as a percentage of what the bond currently costs.
This guide explains how bonds are priced, why yields and prices move in opposite directions, what drives yields up and down, and how to read the yield curve without over-reading it. All numeric examples are hypothetical and chosen to make the arithmetic easy to follow.
What a bond actually is
A bond is a loan that can be traded. A government, company or public agency borrows money from investors and promises two things: regular interest payments, called coupons, and the return of the original amount, the face value or principal, on a fixed date known as maturity. Short-dated government securities mature in weeks or months, while long-dated bonds can run for thirty years or more.
Imagine a bond with a face value of $1,000, a coupon of 4% and ten years to maturity. It pays $40 a year until it matures and then returns $1,000. Those payments are fixed by the contract. What changes every day is the price at which the bond trades in the market, and that is where yields come from.
Coupon, current yield and yield to maturity
- Coupon rate. The fixed interest set when the bond is issued, quoted against face value. It never changes.
- Current yield. The annual coupon divided by the current market price. A $40 coupon on a bond priced at $950 gives about 4.2%.
- Yield to maturity. The single annual rate that makes the present value of all remaining payments equal to today's price. It also accounts for the gain or loss from buying above or below face value, which is why it is the figure normally quoted in the news.
When commentators say the ten-year yield is 4%, they mean the yield to maturity on a benchmark ten-year government bond. The calculation assumes the investor holds the bond until it matures and that the issuer pays in full.
Why prices and yields move in opposite directions
This is the idea that confuses most beginners, and it follows directly from the fixed coupon. Suppose market interest rates rise so that newly issued ten-year bonds now offer 5%. Nobody will pay $1,000 for your 4% bond when a new one pays more, so the price of your bond has to fall until its overall return matches the new alternatives.
Discounting the remaining payments at 5% puts the value of the 4% ten-year bond at roughly $923. The buyer receives $40 a year plus the gradual climb back to $1,000 at maturity, which together produce a 5% yield. If market rates instead fall to 3%, the same bond becomes attractive and its price rises to roughly $1,085, giving a new buyer a 3% return.
Duration: how sensitive a bond is to rate changes
Not all bonds react equally. The sensitivity of a bond's price to a change in yields is summarised by a measure called duration, which is expressed in years. A bond with a duration of seven years will, as a rough rule, lose about 7% of its price if yields rise by one percentage point, and gain about 7% if they fall by the same amount.
Long maturities and low coupons produce high duration. That is why long-dated bonds can swing sharply when rate expectations change, while short-term bills barely move. Investors who hold bond funds should check the fund's average duration, because it shows how much interest-rate risk they are carrying.
What pushes yields up or down
- Central-bank policy. The policy rate set by a central bank anchors short-term yields, and expectations about future decisions shape longer ones. The Federal Reserve explains its framework on its monetary policy pages.
- Inflation expectations. Lenders want a return above expected price rises. When inflation looks likely to be higher, they demand higher yields to protect purchasing power.
- Growth outlook. Strong growth tends to lift yields because borrowing demand rises and policy may tighten. Weak growth tends to pull them down as investors seek safety.
- Supply and demand. Large government borrowing means more bonds to sell, which can push prices down and yields up unless buyers step forward. Demand from pension funds, banks and foreign investors works in the other direction.
- Credit risk. The more likely a borrower is to miss payments, the higher the extra yield, called a spread, that investors require compared with a safe government bond.
Real yields and the inflation link
A nominal yield tells you the stated return, but what matters for purchasing power is the real yield: the nominal yield minus expected inflation. If a bond yields 4% and inflation is expected to average 2.5%, the real return is about 1.5%. Some governments issue inflation-linked bonds whose principal adjusts with a price index, so their yield is quoted directly in real terms. Comparing the two types gives a market-based hint of what investors expect inflation to be, often called the breakeven rate.
This is why an inflation report can move bond markets within minutes. A higher-than-expected reading raises the chance of tighter policy and lowers the real value of fixed payments, so prices fall and yields rise. Our guide to reading an inflation report explains the data behind that reaction.
The yield curve
The yield curve plots yields for bonds of the same issuer across different maturities, usually from three months to thirty years. Looking at the whole curve is more informative than looking at one point on it, because it shows what lenders require for committing money for longer or shorter periods.
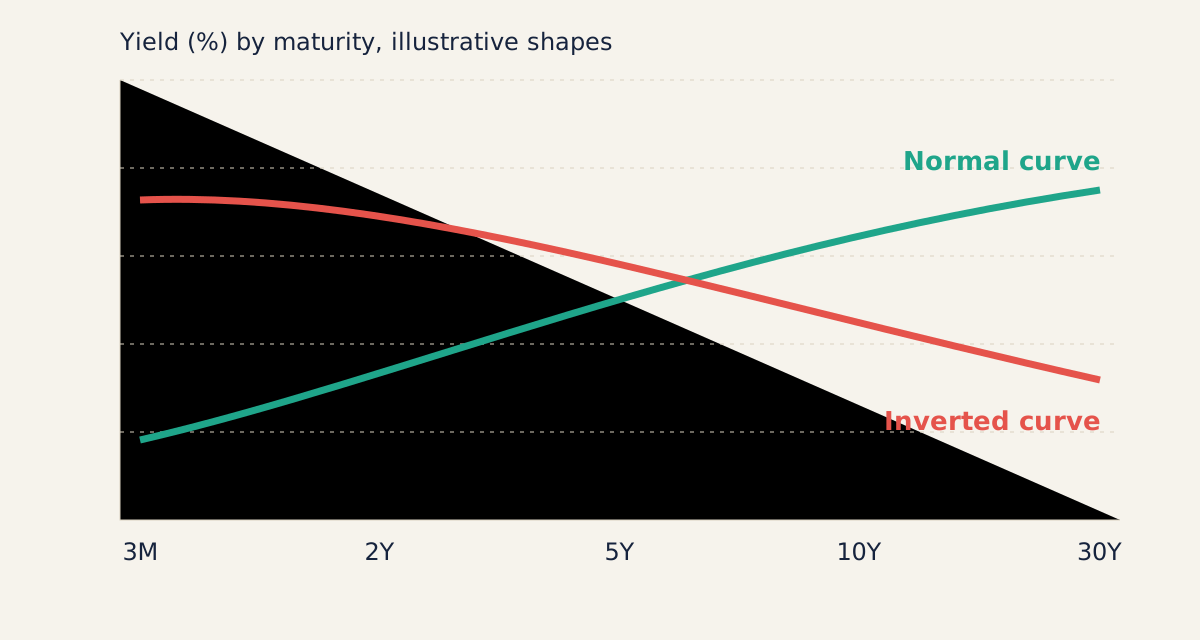
- Normal (upward-sloping). Longer maturities pay more. Lenders usually want extra compensation for tying up money longer and for uncertainty about inflation.
- Flat. Short and long yields are similar, which often appears when the market is unsure about the next phase of the cycle.
- Inverted. Short-term yields are higher than long-term ones. This tends to occur when a central bank has pushed short rates up to fight inflation while investors expect rates to fall later, often because growth may weaken.
An inverted curve, especially the gap between two-year and ten-year yields, has been followed by economic slowdowns in several past cycles in the United States, which is why it receives so much attention. It is a signal, not a law. The timing between inversion and any downturn has varied, and some inversions have not been followed by a recession. Treat it as one input among many.
Mistakes to avoid when reading yield headlines
- Confusing yield with coupon. The coupon is fixed; the yield changes with the price.
- Assuming bonds are risk-free. Government bonds carry little default risk in stable economies, but their prices can fall sharply when yields rise, and long bonds can lose value before maturity.
- Ignoring tax and inflation. A yield means little until you compare it with inflation, fees and the tax treatment where you live.
- Reading one day's move as a trend. Daily moves often reflect positioning and data surprises, not a lasting change in the outlook.
Why it matters beyond the bond market
Government yields act as a benchmark for much of the financial system. Mortgage rates, corporate borrowing costs and the valuation of shares all reference them. When yields rise, future company profits are discounted more heavily, which can weigh on growth stocks in particular. When yields fall, borrowing becomes cheaper and savers earn less on safe assets. Understanding yields therefore helps in reading everything from a housing market report to an earnings season.
For individuals, the practical lessons are modest. Match bond investments to the time you will need the money, check duration before buying a bond fund, compare yields with expected inflation, and diversify rather than betting on a single rate forecast.
Sources and further reading
- TreasuryDirect: Marketable securities (bills, notes, bonds, TIPS)
- Investor.gov (U.S. SEC): Bonds
- Federal Reserve: Monetary policy
- Bank for International Settlements: research and publications
- European Central Bank: Financial markets and interest rates statistics
This article is for information and education only and is not investment, tax or legal advice. Figures, rules and dates change; verify details with official sources before acting. See our Financial Disclaimer and Editorial Policy. Spotted an error? Tell us.
More from Wells Love

Fintech & AI
Central Bank Digital Currencies Explained: Promise, Risks and the Global Race
More than a hundred countries are researching digital versions of their national currencies. The designs, motives and trade-offs differ widely, and the debate is far from settled.

Markets & Economy
How to Read an Inflation Report: What the CPI Number Really Measures
Every month, a single percentage moves bond yields, currencies and central-bank expectations. Understanding how that figure is built, and where it misleads, is the first step to reading the economy.

Fintech & AI
How AI Is Quietly Rewriting the Way Banks Measure Risk
From fraud detection to credit decisions, machine learning is moving from pilot projects to the core of banking. The harder question is who checks the models.
Rate this article